
⚖️ Disputes Dashboard
The Disputes Dashboard is purpose-built to help you understand the full impact of chargebacks and pre-arbitrations — including dispute frequency, recovery success, and the net financial outcome to your business.
This dashboard combines performance tracking, loss analysis, and program evaluation, making it invaluable for finance, risk, and chargeback management teams.
🧮 KPI Section (Top)
This section surfaces all the key metrics related to chargeback volume, dollar impact, recovery, and overall dispute health. Each metric includes performance over time and is calculated based on deduplicated dispute-level data.
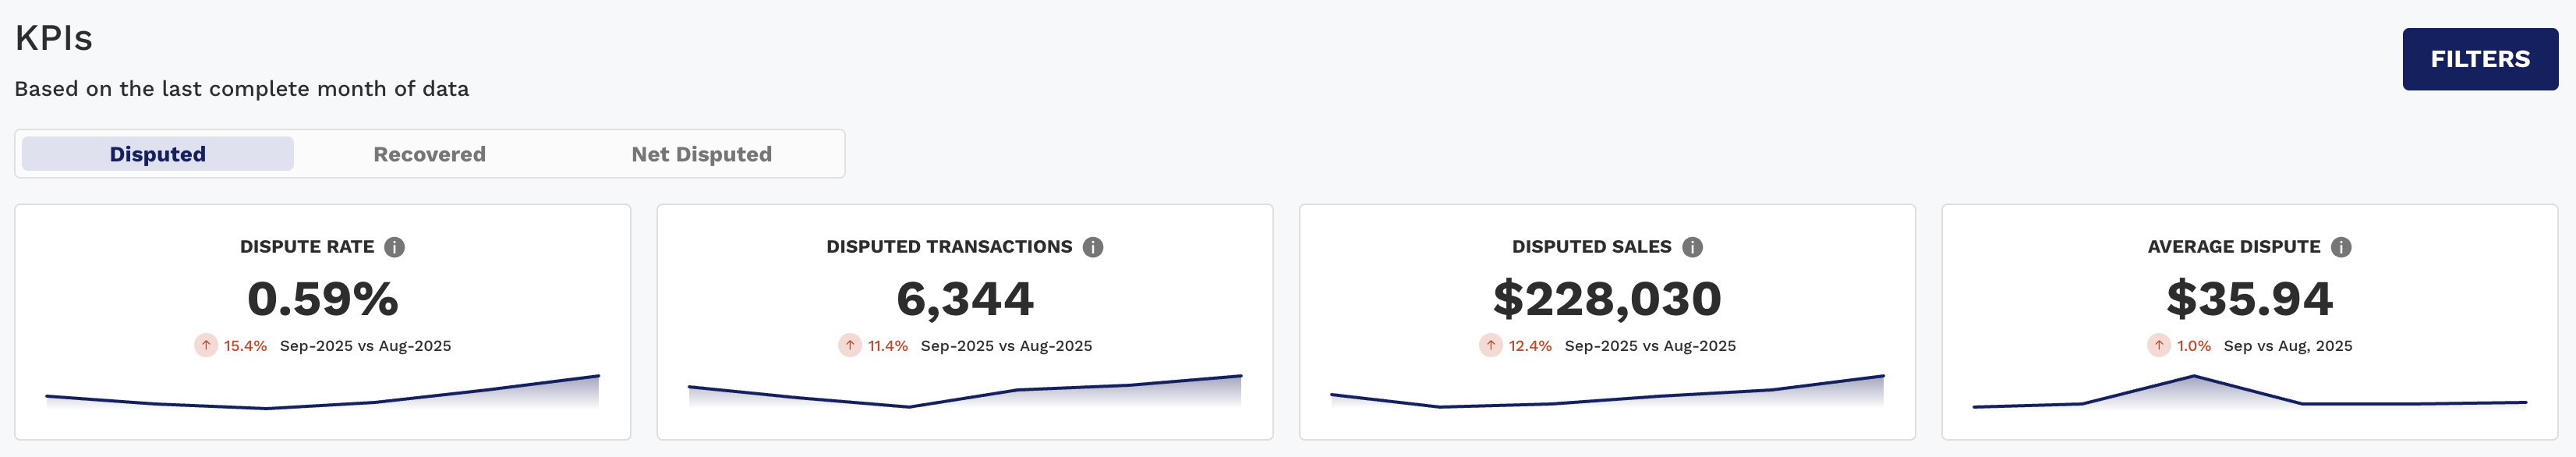
KPI | Purpose |
|---|---|
Dispute Rate | Understand your chargeback frequency as tracked by networks like Visa, Mastercard, Amex, and Discover. |
Disputed Transactions | Understand how many transactions were involved in disputes. |
Disputed Sales | Gauge the total dollar value impacted by disputes. |
Average Dispute | Evaluate the average value of disputed transactions vs. typical sales. |
Win Rate | Assess how often disputes are resolved in your favor. |
Recovered Transactions | Understand how many disputes were ultimately reversed or neutralized through dispute resolution. |
Recovered Sales | See how much of disputed revenue was saved. |
Average Win | Understand if high-value disputes are being won — critical for ROI on dispute management. |
Net Dispute Rate | Know the percentage of transactions lost to all transactions. |
Net Disputes | Reflects how much of your disputed sales were not recovered. |
Net Disputed Sales | Same as Net Disputes, focused on dollar impact. |
Average Loss | Assess if you're losing high-value disputes — key for financial impact modeling. |
📌 Each KPI includes time comparisons, color-coded trend arrows, and trendlines to show directional performance.
Gauge Charts (Dispute Rates by Network)
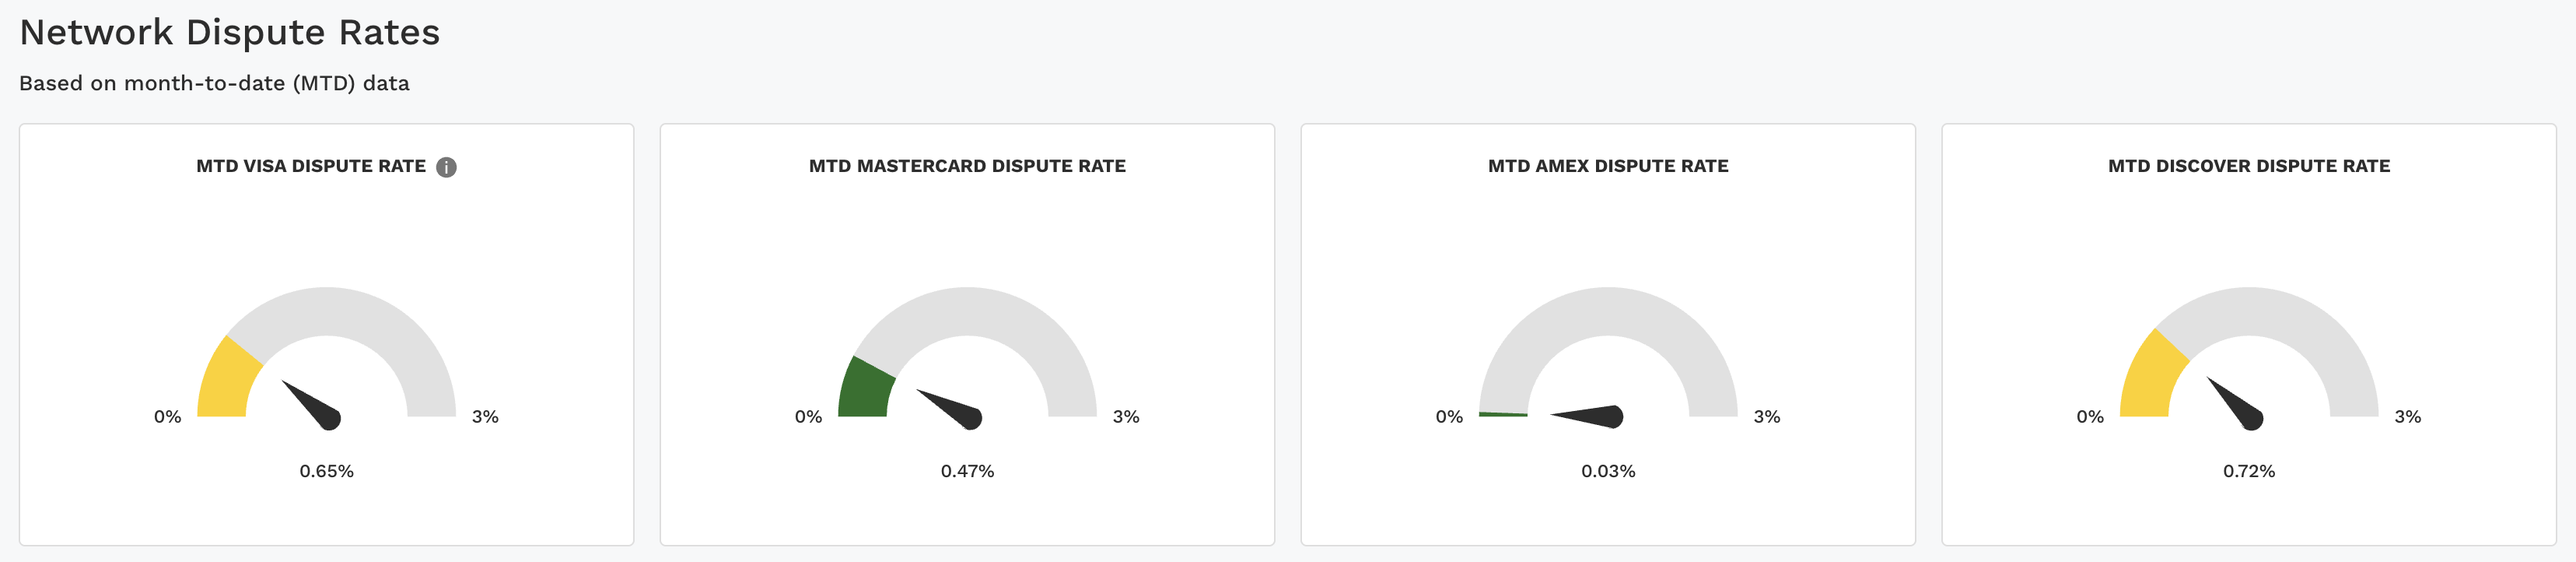
The gauge charts display dispute rates for Visa, Mastercard, Amex, and Discover. Each chart runs from 0% to 3%, with the arrow showing the current rate. The color bands highlight the health of the rate:
🟢 Green (0–0.5%) – Healthy range, disputes are low and within expectations.
🟡 Yellow (>0.5–1%) – Slightly elevated, worth monitoring for changes.
🟠 Orange (>1–1.5%) – Noticeably high, may indicate early issues or risks.
🔴 Red (>1.5%) – Critical level, disputes are high and likely need immediate action.
This structure allows teams to quickly identify which networks are stable and which may require further investigation.
📈 Charts Tab (Dynamic + Waterfall Visuals)
The Disputes Dashboard offers both summary visualizations (Waterfall) and dynamic, interactive trends.
📊 Chart 1: Dispute Performance Over Time
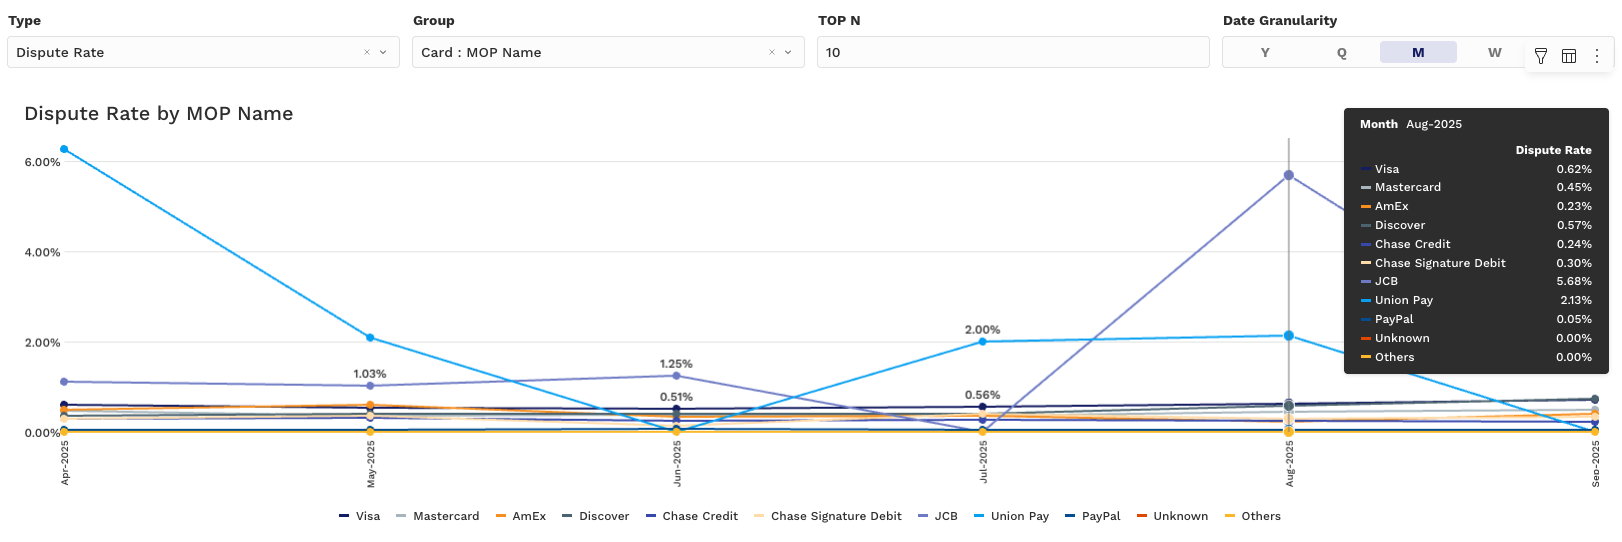
Type Selector:
Dispute Rate
Win Rate
Net Dispute Rate
Y-Axis: Selected Rate (%)
X-Axis: Time (Month, Week, etc.)
Grouped by: PSP, MID, Card Type, Issuer, or Reason Code
📊 Charts 2 & 3: Disputed, Recovered & Net Loss Trends
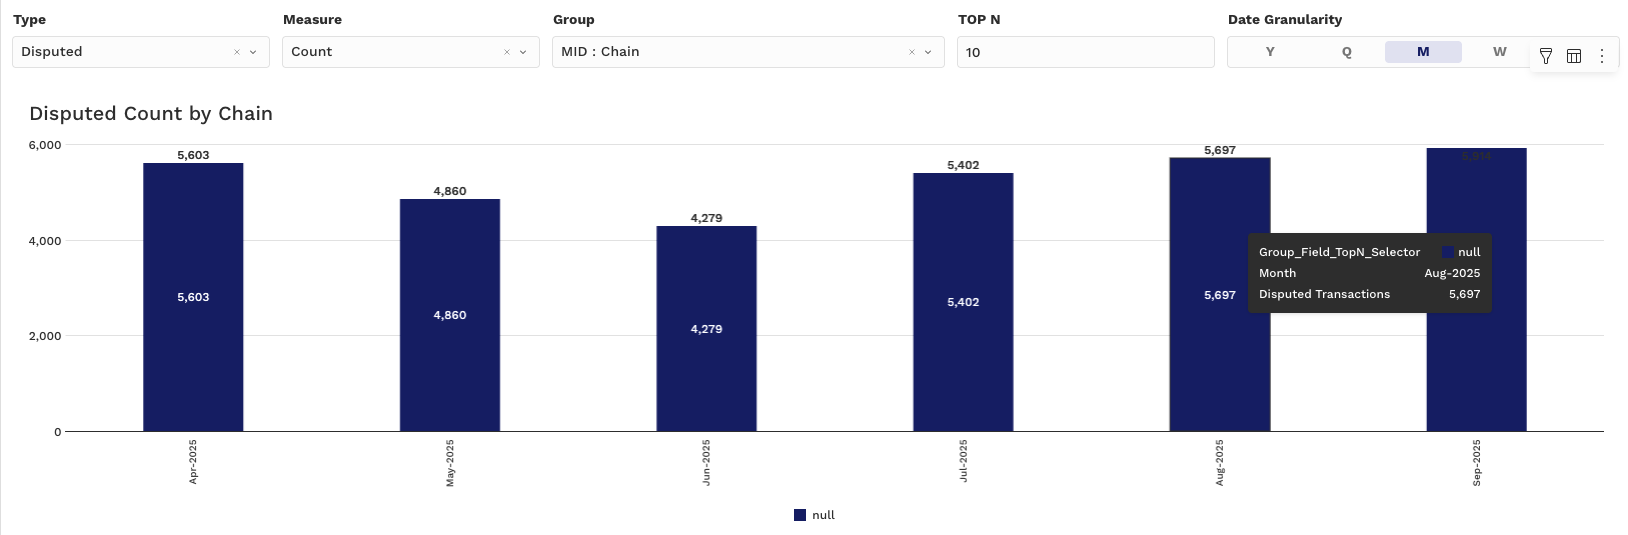
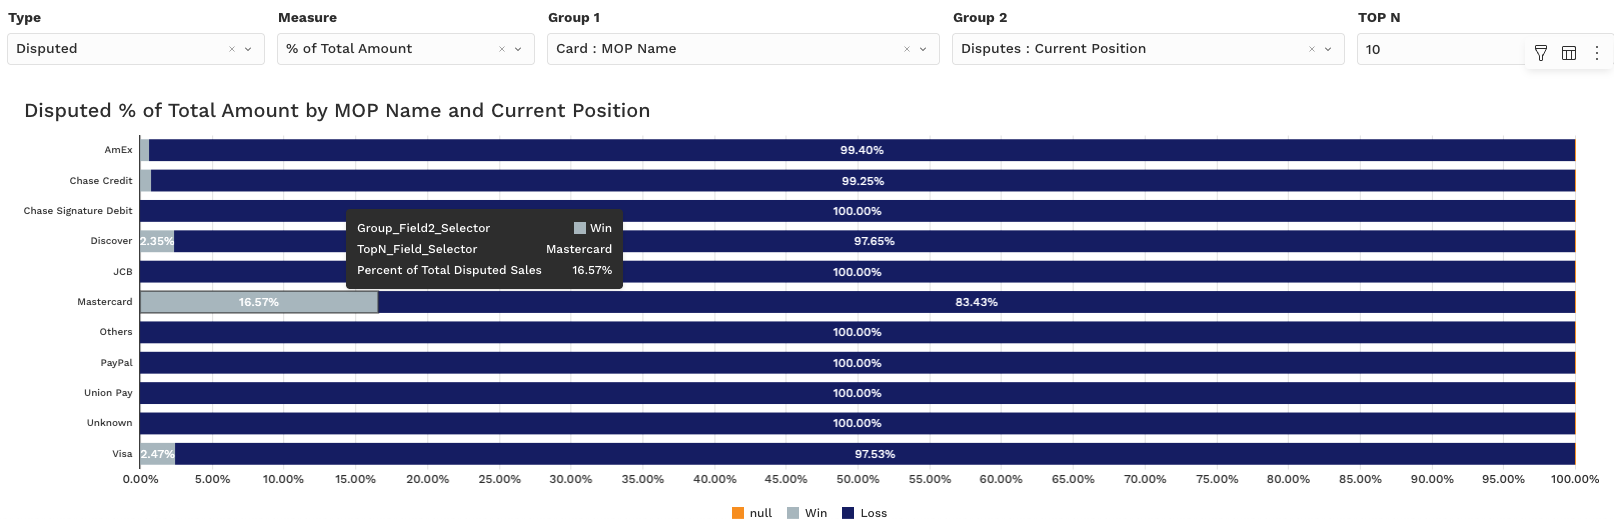
Type Selector:
Disputed
Recovered
Net Disputed
Measure Selector:
Count
Amount
% of Total Count
% of Total Amount
🧠 Use these to:
Compare recovery trends across business units
Surface segments with frequent unresolved disputes
Spot patterns by Issuer, BIN, or MOP
📌 Click elements in the charts to drill down or apply filters to the rest of the dashboard.
📊 Pivot Tab (Dynamic Pivot Tables)
The pivot view enables granular analysis of dispute data with full control over grouping and aggregation, ideal for deep operational audits and finance reconciliation.
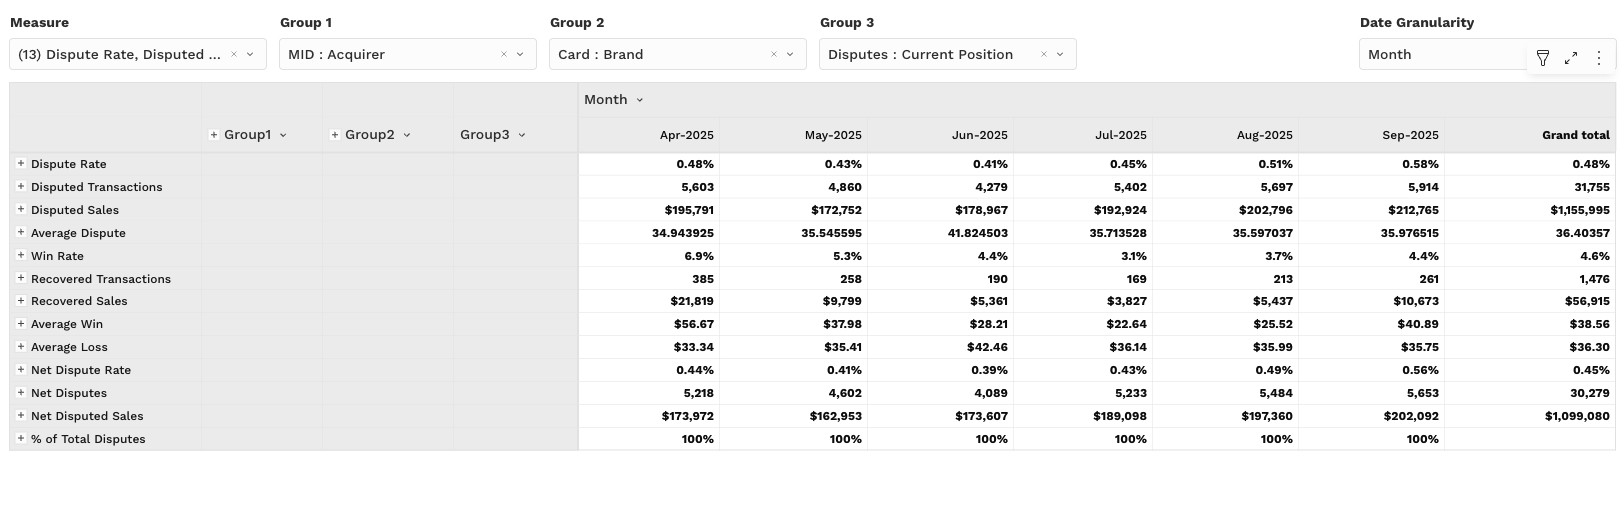
📉 Pivot Table Metrics (Values):
Dispute Rate
Disputed Transactions
Disputed Sales
Average Dispute
Win Rate
Recovered Transactions
Recovered Sales
Average Win
Average Loss
Net Dispute Rate
Net Disputes
Net Disputed Sales
% of Total Disputes
🔧 Key Interactions:
Group by Card Brand, BIN, Issuer, Reason Code, PSP, MID
Filter by time, amount range, or channel
Export to CSV for finance or partner teams
📌 Ideal for answering: “Which card brand has the lowest win rate on high-dollar disputes?” or “Where are we losing more than we’re winning?”
🔍 Filtering Tips
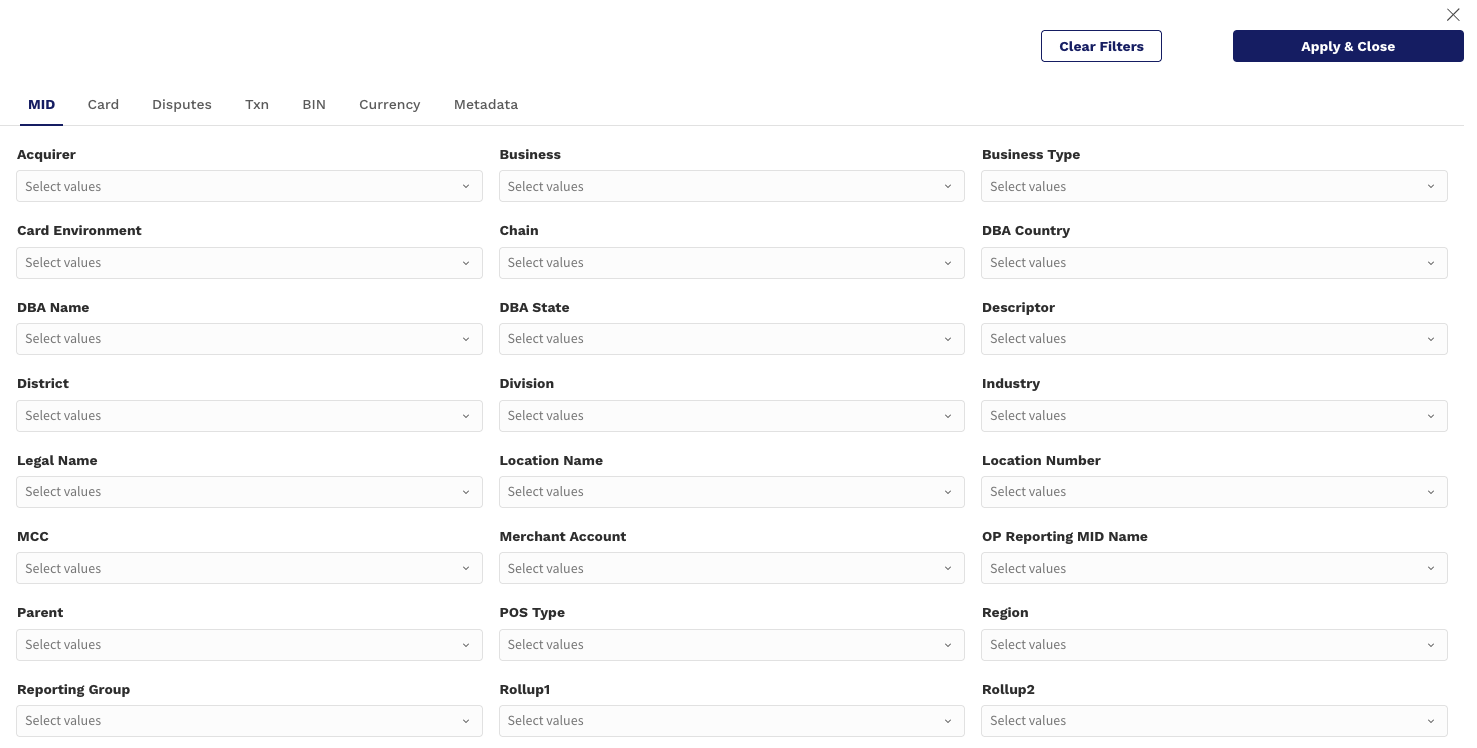
Customize your dispute insights using:
Date Range: Focus on closed cases for stable Win Rate (e.g., 90+ days ago)
Group Filters: Narrow in on Issuers, Regions, Acquirers, or specific Reason Codes
Top N: Focus on your top contributors to dispute volume or loss
💡 Use Case Example:
“Which MIDs are generating the highest net losses from chargebacks in the last 3 months?”
Set Date Range = last 90 days
Filter for Net Disputed > $0
Group by MID
Sort Pivot by Net Disputed Sales or Average Loss