
📊 Overview Dashboard
The Overview Dashboard is your executive summary of the entire payment lifecycle — a single page that brings together key metrics from sales, authorizations, fees, refunds, and disputes.
Use this dashboard as your daily command center or as a starting point for deeper exploration across other tabs. It provides a balanced view of volume, cost, efficiency, and risk.
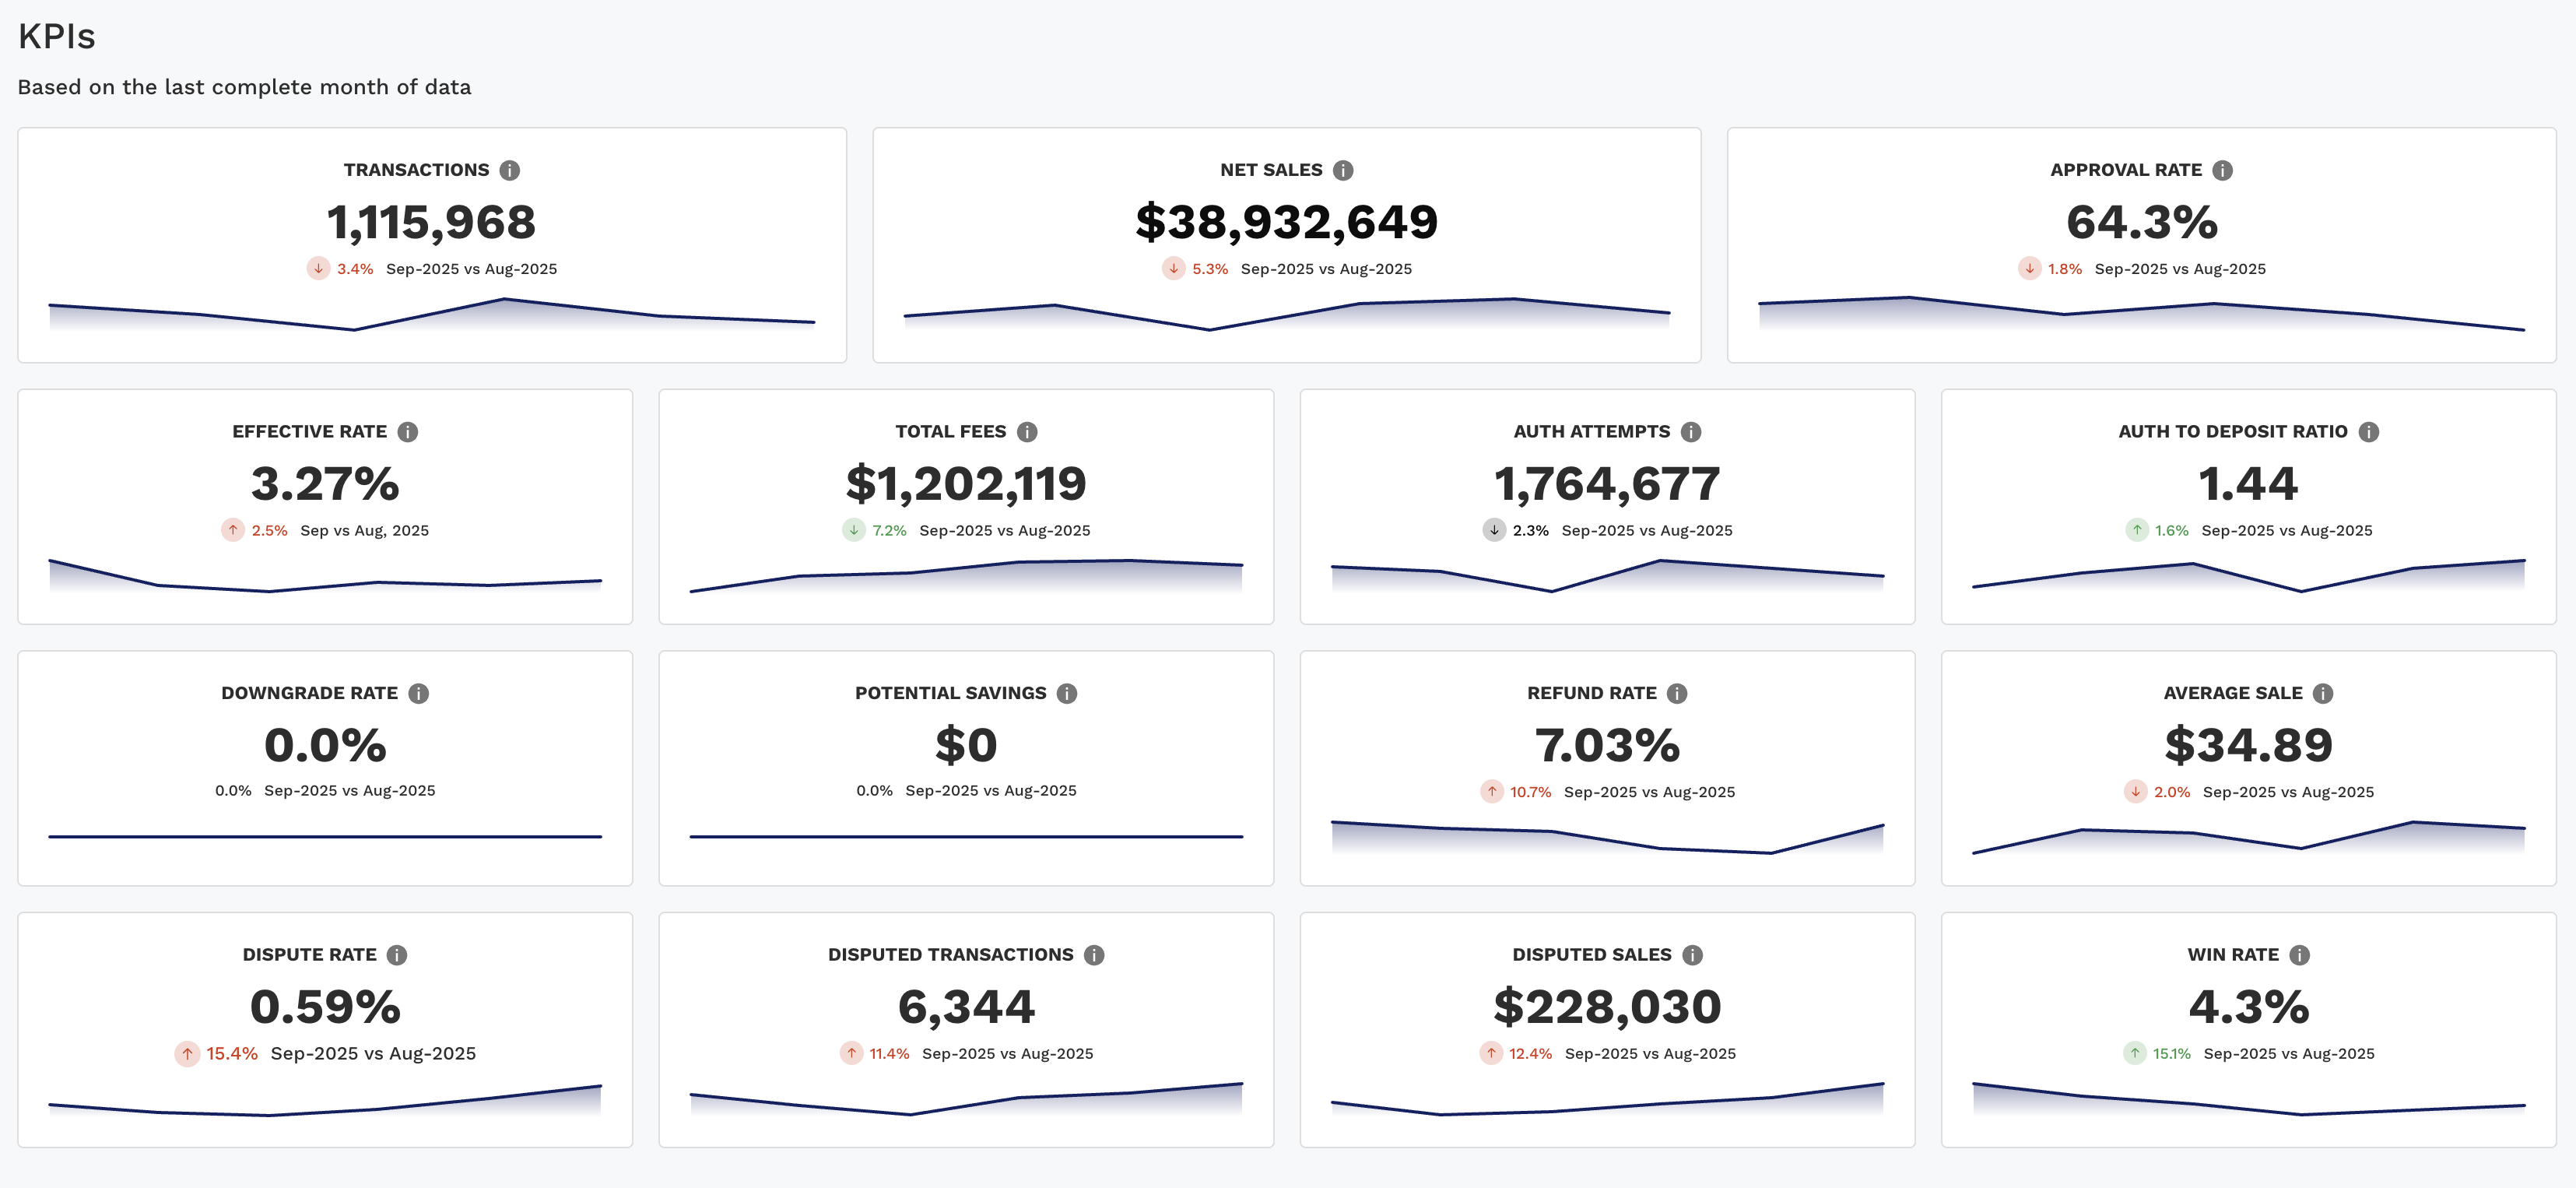
🧮 KPI Section (Top)
This dashboard includes a wide-ranging set of curated KPIs, pulled from across all dashboards. Each one is displayed with period-over-period comparison, trend indicators, and a sparkline to show directional change.
KPI | Description |
|---|---|
Transactions | Total number of settled transactions |
Net Sales | Total dollar value of sales less refunds |
Average Sale | Average value per settled transaction |
Total Fees | Sum of all fees: interchange, network, acquirer, and others |
Effective Rate | Total Fees ÷ Net Sales — your blended cost to process payments |
Approval Rate | Approved Auths ÷ Total Auth Attempts |
Auth to Deposit Ratio | Auths ÷ Settled Transactions (excluding Pay by Bank MOPs, AmEx, Discover, and PayPal) |
Downgrade Rate | % of transactions downgraded to higher-cost interchange categories |
Potential Savings | Estimated $ that could be saved through better qualification or routing |
Refund Rate | % of settled sales that were refunded |
Dispute Rate | % of transactions that resulted in chargebacks |
Disputed Transactions | Count of transactions involved in a dispute |
Disputed Sales | Total dollar amount associated with disputes |
Win Rate | % of disputes that were reversed (final or initial outcomes) |
📌 This dashboard includes metrics from all major performance areas and can be filtered by PSP, card brand, method of payment, merchant group, or issuer.
🔍 How to Use This Dashboard
Monitor Trends Over Time
Use the KPI’s to assess how each area is trending month-over-month or quarter-over-quarter.Spot Opportunities or Red Flags
A rising Downgrade Rate or Dispute Rate may require immediate investigation
A low Auth to Transaction Rate could indicate settlement issues
High Potential Savings means there’s room to optimize routing or qualification logic
🧠 When to Use
Use Case | Why Overview Helps |
|---|---|
Leadership Reporting | See the full business picture in one place |
Weekly Ops Reviews | Quickly identify areas that need attention |
Monthly Recaps | Assess health across teams without toggling dashboards |
Routing Optimization | Monitor metrics like Approval Rate, Downgrade Rate, and Effective Rate in tandem |
Chargeback Management | Track Dispute Rate, Win Rate, and Disputed Sales in context with other KPIs |