
💰 Sales Dashboard
The Sales Dashboard provides a complete view of how revenue flows through your payment system — from gross sales and net sales to refund activity and refund rate.
This dashboard helps teams monitor top-line performance, measure refund impact, and identify areas for revenue recovery or operational improvement.
🧮 KPI Section (Top)
The KPI section gives you a real-time summary of both sales and refunds so you can quickly assess overall transaction health and customer behavior.
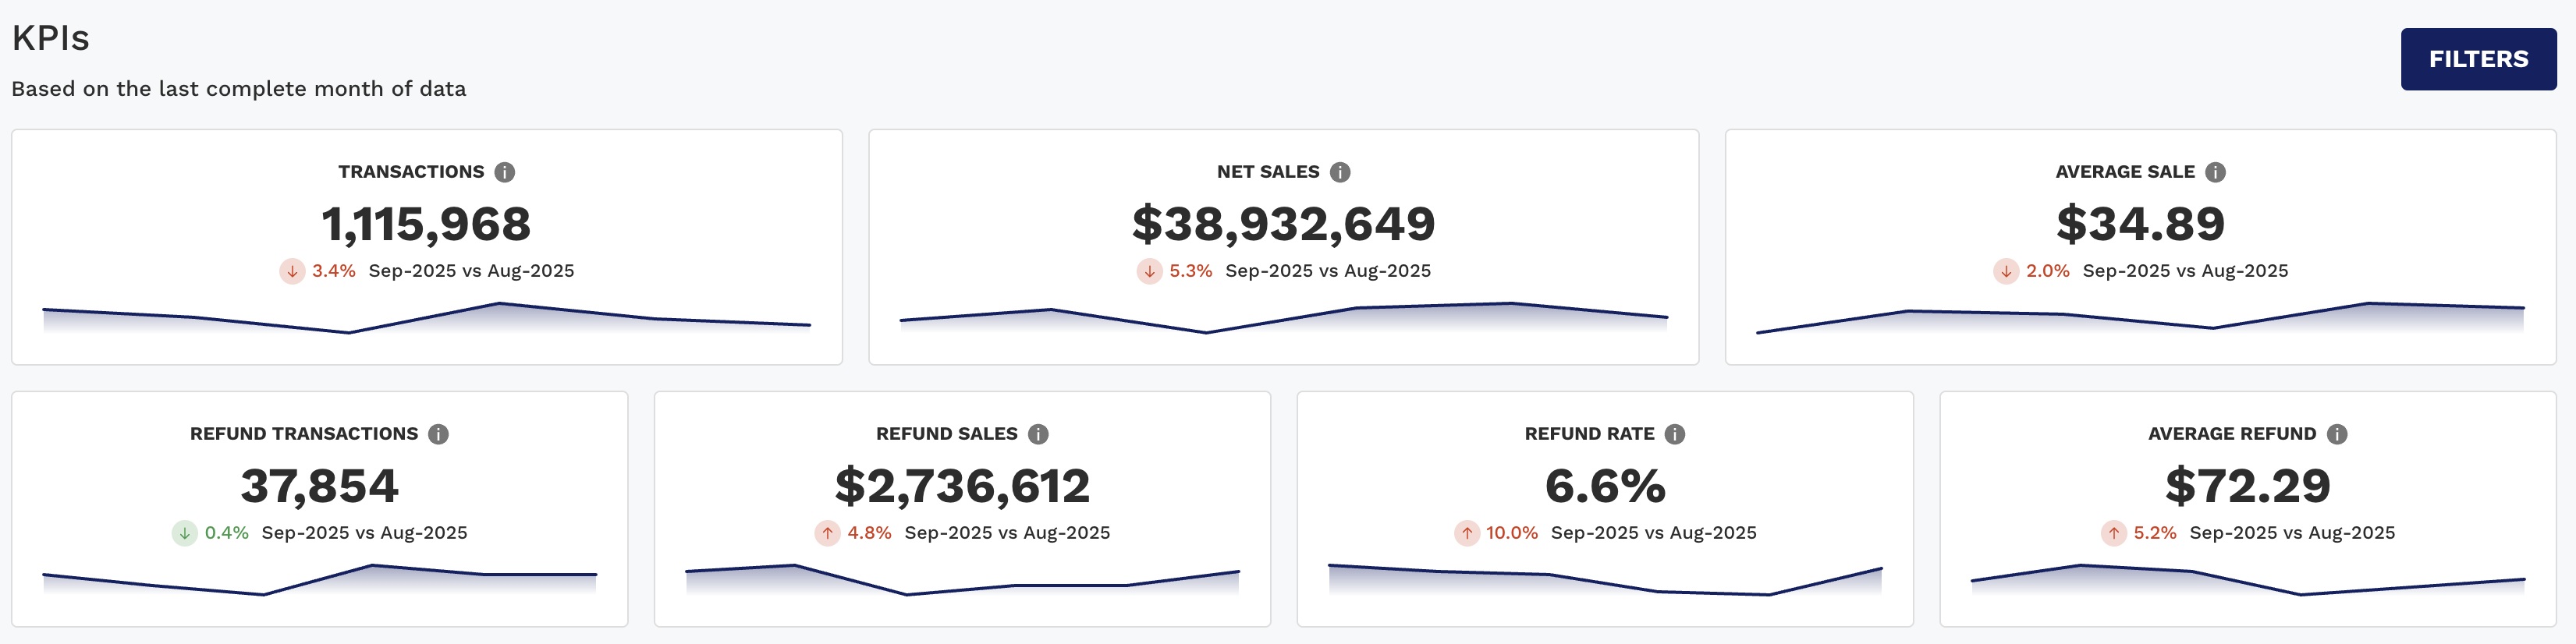
KPI | Description |
|---|---|
Transactions | Count of all captured/settled transactions. |
Net Sales | Total sales minus refunds — your true revenue after returns. |
Average Sale | Average value of a single sale transaction. |
Refunds | Total number of refunded transactions. |
Refund Rate | % of sales transactions that were refunded. |
Refund Amount | Total dollar amount refunded. |
Average Refund | Average value per refund transaction. |
📌 These KPIs include period-over-period comparisons (e.g., Feb vs Jan), with arrows and color indicators to highlight performance changes.
📈 Charts Tab (Dynamic Charts)
This tab allows you to track trends and compare segments over time across both sales and refunds.
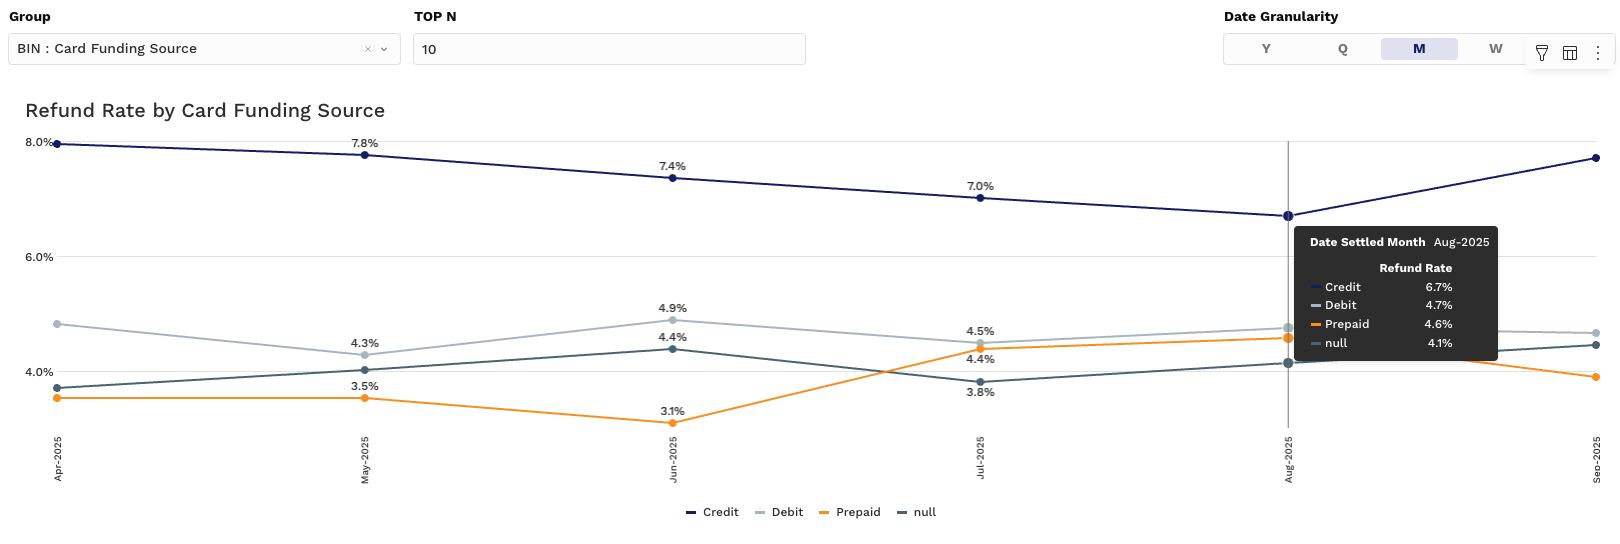
📊 Chart 1: Refund Rate Over Time (Line Chart)
Y-Axis: Refund Rate (%)
X-Axis: Time period (Month, Week, etc.)
Grouping: Choose from fields like Card Type, Region, PSP, or MID
Use this to monitor refund trends and identify any seasonal or segment-specific spikes in returns.
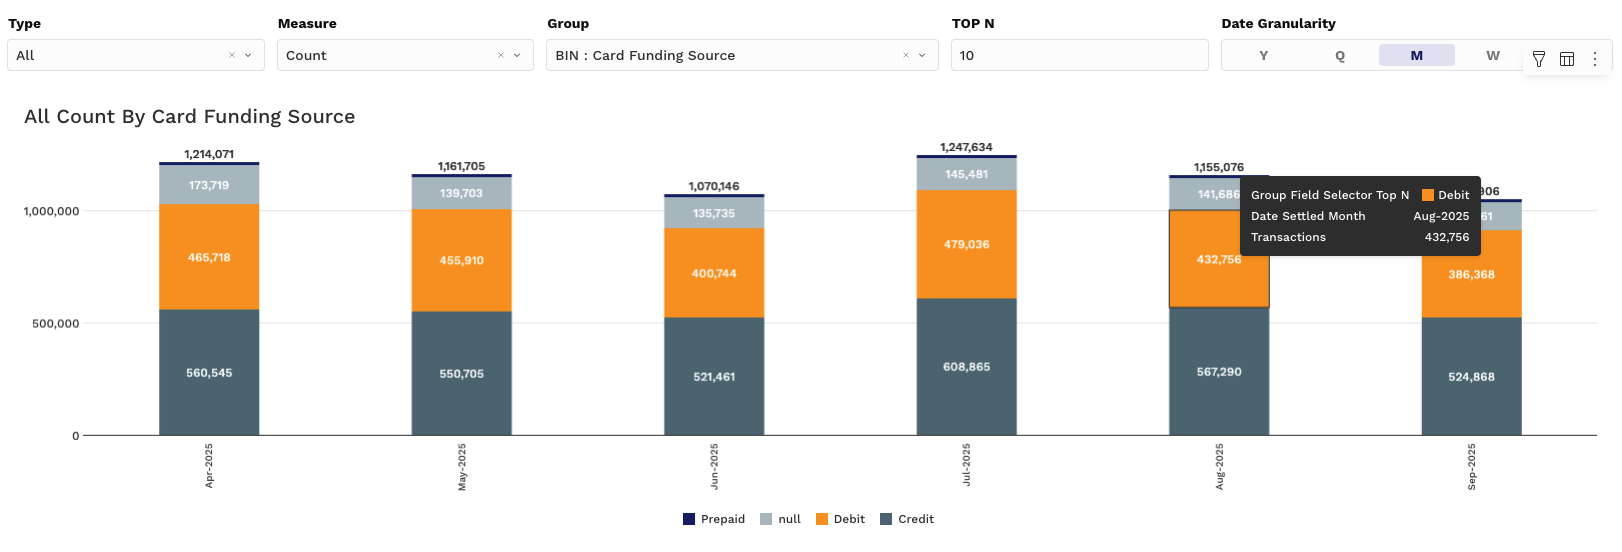
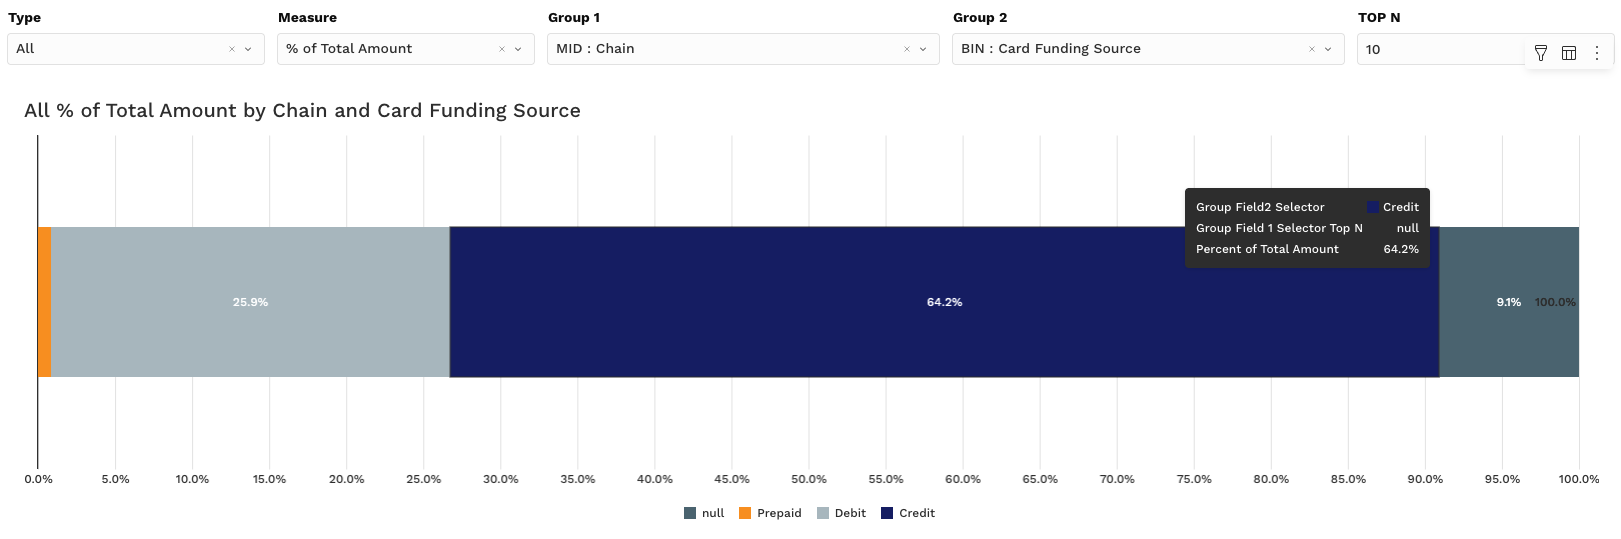
📊 Charts 2 & 3: Volume and Value Comparisons (Stacked Bar)
These charts let you toggle between sales and refund views and analyze how volume and value are distributed.
Controllers:
Type Controller
All – shows both Sales and Refunds side-by-side
Sale – isolates only sales activity
Refund – focuses only on refund activity
Measure Controller
Count – Number of transactions
Amount – Dollar value
% of Total Count – Share of volume
% of Total Amount – Share of sales or refunds by group
🧠 Use these to:
Identify high-refund merchant segments or payment types
Compare contribution of PSPs to gross vs. net revenue
📌 You can layer in grouping fields and change date granularity to fine-tune your trend comparisons.
📊 Pivot Tab (Dynamic Pivot Tables)
For more granular reporting and reconciliation, the Pivot section breaks down all sales and refund-related values by group.
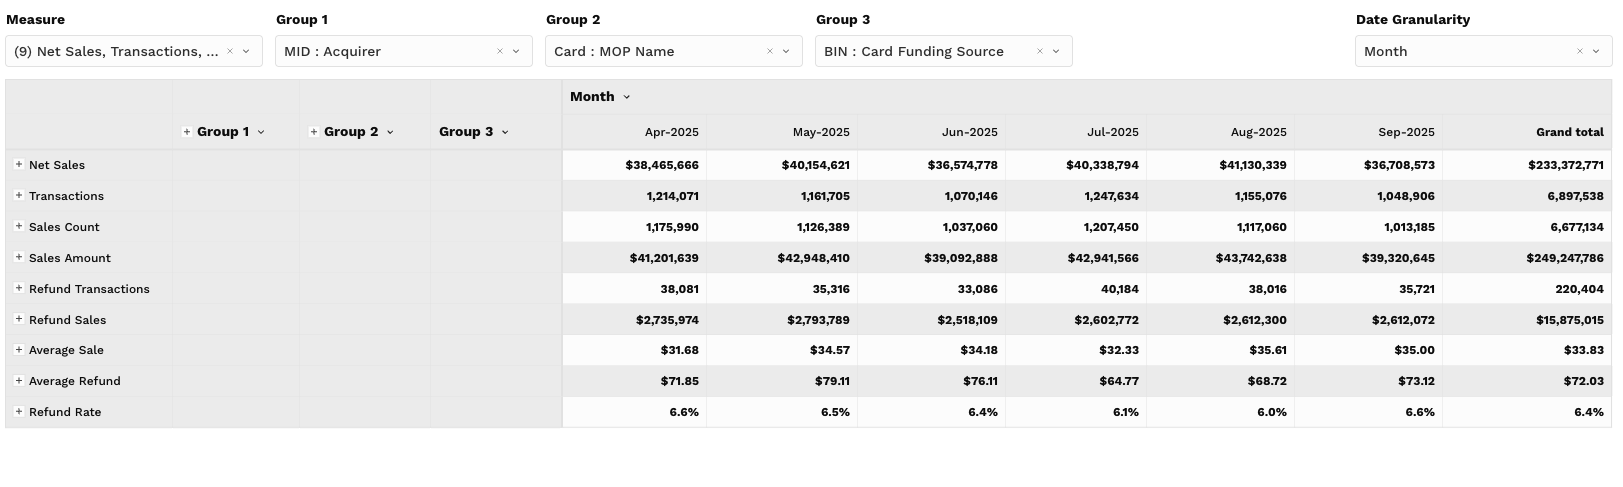
📉 Pivot Table Metrics (Values):
Net Sales
Transactions
Sales Count
Sales Amount
Refund Transactions
Refund Sales
Average Sale
Average Refund
Refund Rate
🔧 Key Interactions:
Group by PSP, MID, Card Brand, Method of Payment, etc.
Compare refund rates by region or sales channel
Export results to CSV or Excel for audit, finance, or operational follow-up
📌 Ideal for answering: “Where is refund volume disproportionately high relative to sales?”
🔍 Filtering Tips
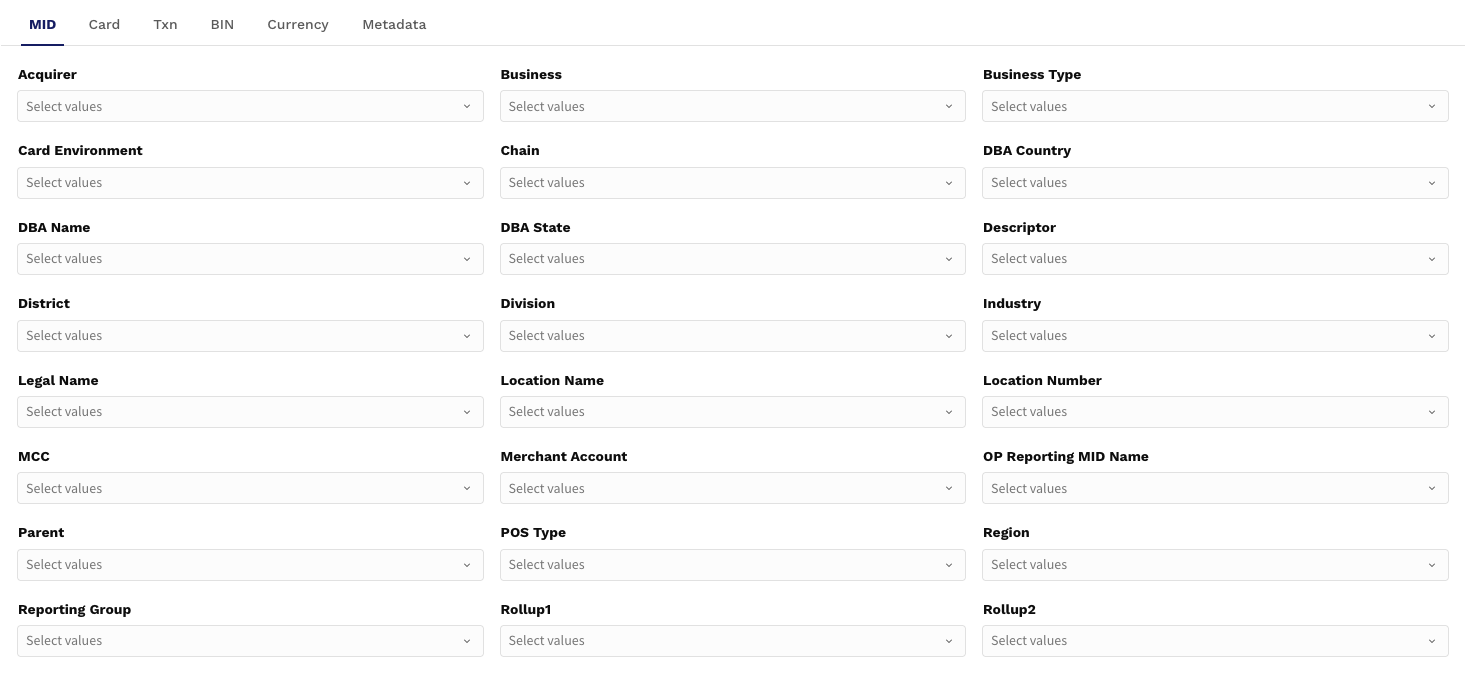
To customize your Sales Dashboard experience:
Date Range: Focus on current month, quarter, or custom time periods
Amount Range: Analyze high-value refunds or large sales transactions
Group Filters: Isolate specific merchant IDs, PSPs, or card brands
Top N: Limit charts/pivots to the top refunding divisions or highest-selling MOPs
💡 Use Case Example:
“How are refunds trending for high-dollar sales from the top 5 MIDs over the last quarter?”
Filter by Date Range = last quarter
Set Amount Range = $500+
Apply Group Filter = MID
Top N = 5
Analyze via Chart 1 and Pivot